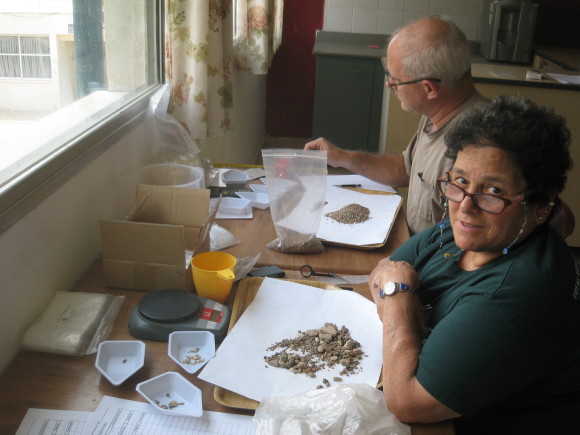
For a few days now I’ve been helping with some archaeobotany. Anyone who knows me knows I don’t really like biology, being more of a physical sciences kind of gal, but, this is interesting. We take soil samples that are “floated” to find any seeds, and other organic remains. In the process, there is a portion of the sample that falls to the bottom of the tank of water, the heavy fraction. I’ve been sorting through the heavy fractions. We find shells, pieces of pottery, bronze, lead and bones. On some of the samples, when we run a magnet over them we get pieces of slag, the remains of iron ore processing, and hammer scales, the remains of iron tool making. These are tiny blobs of iron that are forced off when the hot metal is struck. The samples are sort of a grab bag of the areas we are working as part of Total Archaeology at Tel Akko, a joint project of Penn State and Haifa University.

Because I’m used to doing large database analysis, I thought, What if we took the various finds from the heavy fraction and used a geographic information system (GIS) to place them on a map and do some analysis? We could see the areas where iron working went on and those where bronze smelting took place. We could see where the majority of animal bones occurred and map the interaction of the various artifact types. This might give us another look at what went on during various time periods.
I asked our archaeobotanist, Melissa Rosenzweig, and she said that this type of analysis is commonly done (so much for a brilliant idea), but that microdebris analysts are hard to come by. OK, but now with major computer power and GIS, one probably doesn’t need a specialist because the programs can do most of the work if you feed them properly. So I wasn’t totally discouraged.
The most important thing for this type of work is that the finds be geolocated. That is, each location actually be recorded as a map coordinate of some kind.
So I asked if our loci (the assigned area from which a sample comes) had coordinates. They don’t. Not to worry. We have a GIS map of the site that changes every day. I asked the person responsible for the mapping and “top plans” – the birds-eye-view maps of the area – if we could or had geolocated the areas necessary and she said we could, but it would take some work.
So with a little work we could get the coordinates, do the database magic and plug it into the GIS. Not necessarily trivial, but doable, and we might actually see something interesting by separating the time periods and looking at them through time and space. Exactly what GIS is intended to do.
And then I find out that there are already plans to do just what I was thinking about for the iron slag and hammer scales.
So dies a good idea.
